Inventory Management – A Critical Leg in the “Three-Legged-Stool” of Demand Management

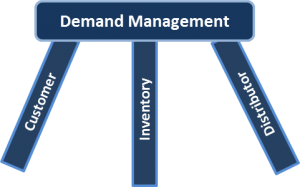
Demand management has different meanings to different audiences. For the sake of this discussion, demand management is defined as an understanding of the underlying elements driving revenue sales, and how they interact with one another. The interactions utilize a “three-legged stool” frame of reference.
Question: Why this analogy?
Answer: A three-legged stool cannot stand up with only two legs. It must have all three legs operating simultaneously to be a stable structure. Demand management follows a similar logic. It also has three legs. The legs are different but highly related data streams of information. If you use only one and/or two sources of information, you are not likely to make the “right“ demand management assessment.
Background
Let’s dig more into the three legs or data streams. I would like to use the term data streams interchangeably with information streams because this implies the data has been processed and the analytical “art” applied to make it into useable information (no small task!). This is the heavy lifting that is the critical building block phase to ensure the three “legs” have the integrity to be correlated with one another.
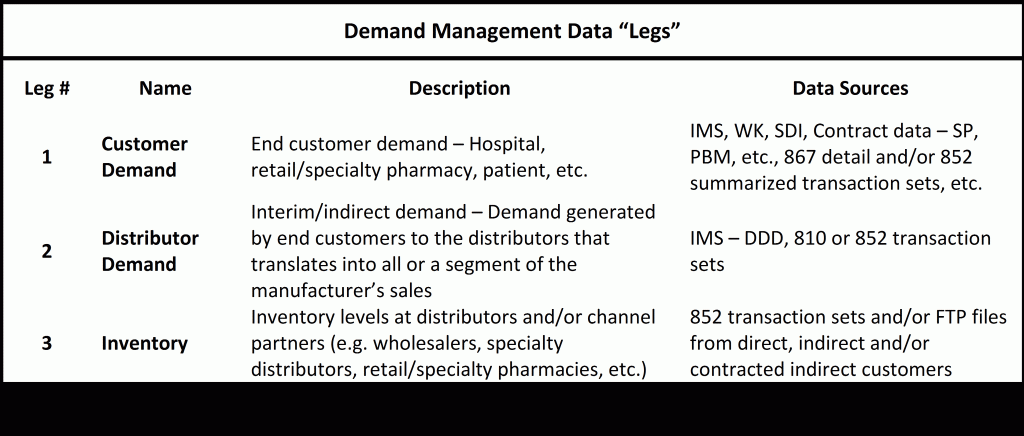
The three legs are categorized as; Leg #1 – Customer Demand, Leg #2 – Distributor Demand and Leg #3 – Inventory. The two diagrams below illustrate 1) What the three legs are, and 2) the relationship in terms of product flow and the three legs.


The relative background information for the three legs is identified in Table – Demand Management Data “Legs”. The table below is not intended to be comprehensive, but provides a feel for the data to understand the top-level content in each demand leg.

The complexities in many demand management assessments are in the dynamics within and across the demand legs
Demand Management Analysis
Leg #1 – Customer Demand:
Many organization spend an extensive time is on understanding customer demand through many of the traditional data sets built from end customer demand data (e.g. TRxs, claims, DDD, etc.). These analyses provide excellent customer insights but not always the best demand assessments that are needed across many business areas in the organization from the various stakeholders. Due to a host of reasons around projection methodologies, non-reporters, timing, etc., these analyses can still seem incomplete. It can be frustrating considering the data expenses and exhaustive time spent analyzing these customer demand data sets.
Legs #2 – Distributor Demand:
An additional analysis overlaid on top of customer demand and/or looked at individually is distributor demand. This is tempting to use based on the direction connection to revenue sales. This also can be problematic when looked at in a vacuum because of business events (e.g. sales promotions, release of data, etc.), wholesaler system ordering characteristics (e.g. inertia), and product life cycle position (e.g. generic, launch, etc.) are all collectively influencing demand. These indirect demands (relative to the manufacturer) are dynamic variables that can confound the analytical distributor demand assessment. Not to worry, there is another leg to consider for shoring up the three legged demand assessment!
Leg #3 – Inventory:
With two “legs” of analysis done either individually or jointly, and still not as complete an answer as required delivered yet, this leads us to the third “leg” – inventory to factor in. I call this the “hidden” gem because it can provide relational answers to the first two legs and provide an enormous amount of analytical insights.
The relational aspect is the connection point between customer and distributor demand that is manifested as inventory. The drivers of inventory are directly related to customer and distributor demands. These demands are what establish the variation in inventory levels. The variations in inventory levels when combined with the other information embedded in the 852 and 867 transaction sets can be provide telling analytical insights across all three data legs.
The complexities in many demand management assessments are in the dynamics within and across the demand legs. To comprehensively look at demand management, it requires all legs be assessed both individually and collectively
More About Inventory
The 852 and 867 data sets can provide a vector of insights for inventory, distributor demand, and end customer demand. Like all data it does not come without some limitations (e.g. blinded 867 data, 852/867 reconciliation) but there are options to help “crack-the-code” on items like blinded data and to facilitate these reconciliations. The real value in the inventory information is in its utilization.
Demand management correlations across all three legs help resolve what appear to be gaps in the individual analyses. In my experiences with comprehensive demand management assessments, inventory data helps explain the discontinuities between the customer and distributor demands, while providing invaluable channel/customer level insights. These insights were applied and proved to be complimentary/validated much of the customer analytical assessments and help explain variations in wholesaler demands.
These demand management assessments and insights were actually applied across a variety of business situations around managing multiple product shortages, performing mass flow product balancing and validating critical revenue forecasts in various business planning scenarios.
High confidence demand management assessments provide significant business benefits throughout the organization. Some areas of benefit are revenue forecasting/investor relations, brand planning, targeting, production planning, financial accruals, etc. With this much potential organizational benefits at stake, who can afford not to pursue the most effective and efficient approaches to demand management.
The growth in the specialty products has created a bonified call to action for comprehensive demand management. The call to action is driven by the high costs associated with the specialty products, extensive support services, channel and regulatory complexities resulting in much needed rigorous demand assessments.
Don’t let your three legged stool become a two legged stool and potentially tip over and miss all the benefits associated with a stable three legged demand management stool!